Our experts are always on hand to help answer your questions, get you started, and grow your presence online. You can email us any time
How to read your onion service dashboard
- Knowledgebase
How to read your onion service dashboard
The dashboard shows whether your onion service is running and how much of your plan it uses. Every figure is read from the hosting node, so a value that looks wrong is worth one reload before you open a ticket.
Step 1 — Open the service from the portal
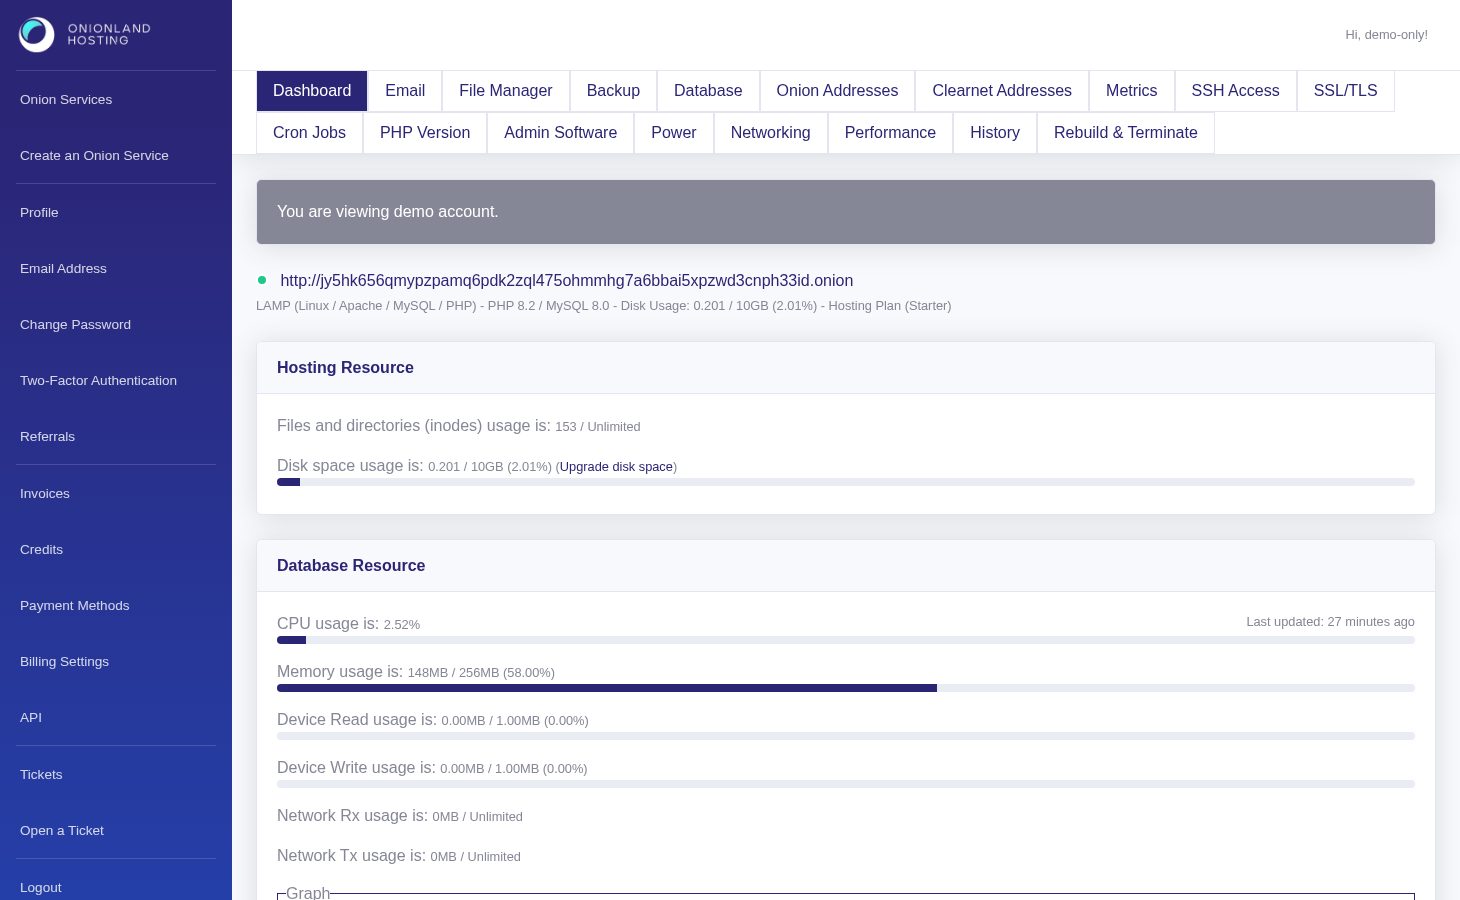
Sign in to the Customer Portal and click the onion address of the service you want to inspect. The colour dot on the left of the address is green while the service is running and red while it is stopped, deploying or rebuilding. Next to it you see the software stack, the PHP and MySQL versions, the disk usage and the name of your hosting plan.
Step 2 — Read the hosting resource card
The "Hosting Resource" card shows the two quotas that most often run out first: the number of files and directories (inodes) and the disk space. Both lines show the value used, the limit and the percentage. The link next to the disk line goes straight to the disk configuration form described in our disk space article.

Step 3 — Read the web server and database resources
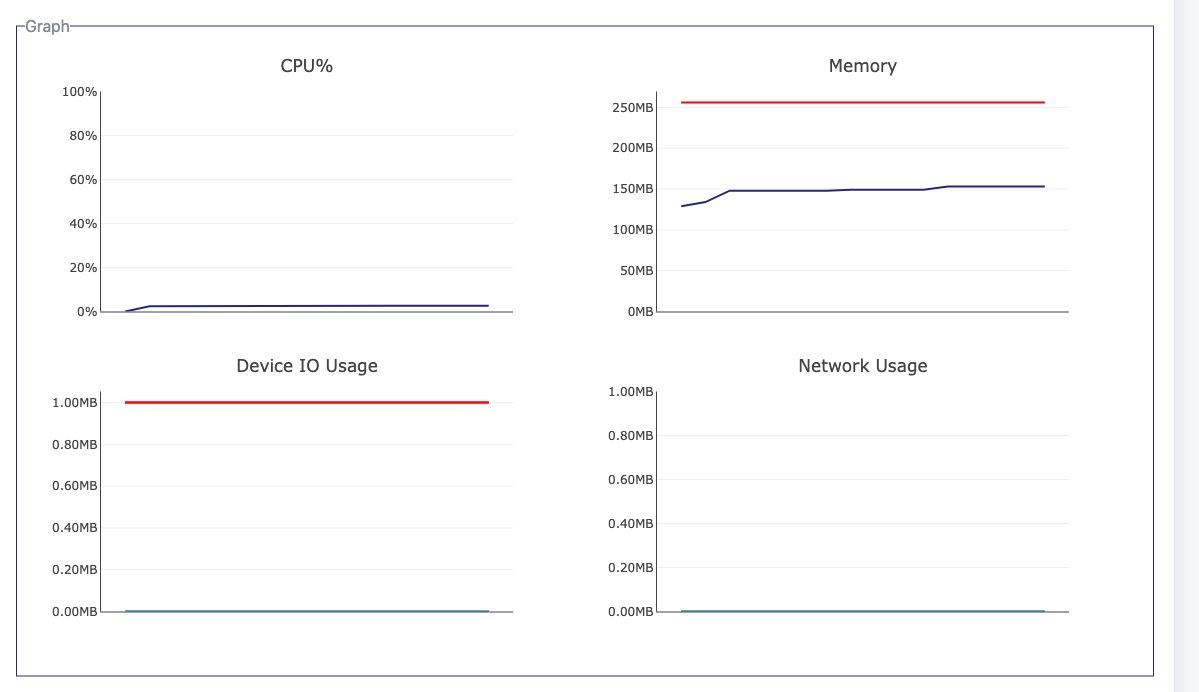
The dashboard reports the database and the web server separately. Each section has its own figures, its own "Last updated" stamp and its own graph box with four charts: CPU %, memory, device I/O and network.
Database
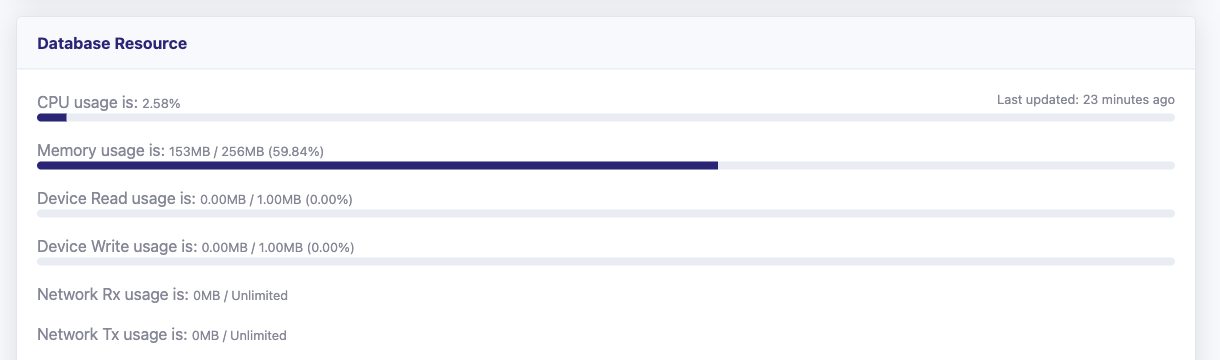
The "Database Resource" card lists the current values for the MySQL instance. A flat line is what an idle database looks like — the shape matters when the site is busy.
Web server
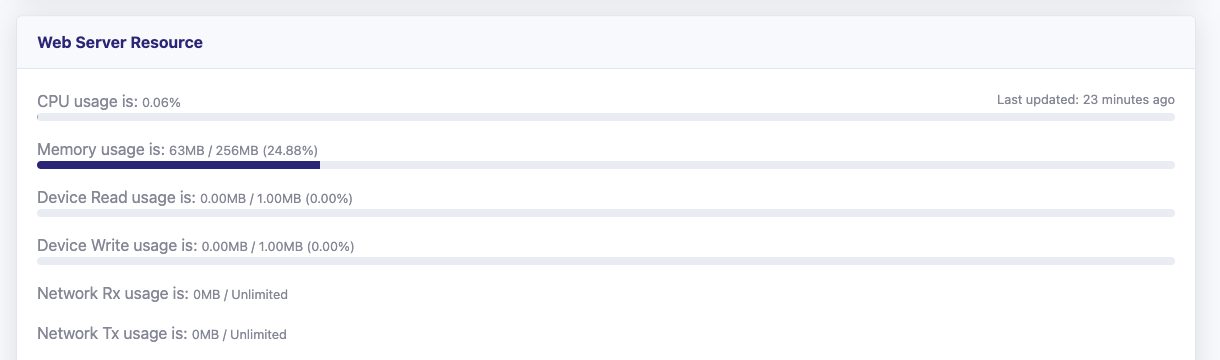
The "Web Server Resource" card does the same for Apache and PHP. Compare the two: a PHP script hammering the database shows up in the database section, slow page renders show up here.
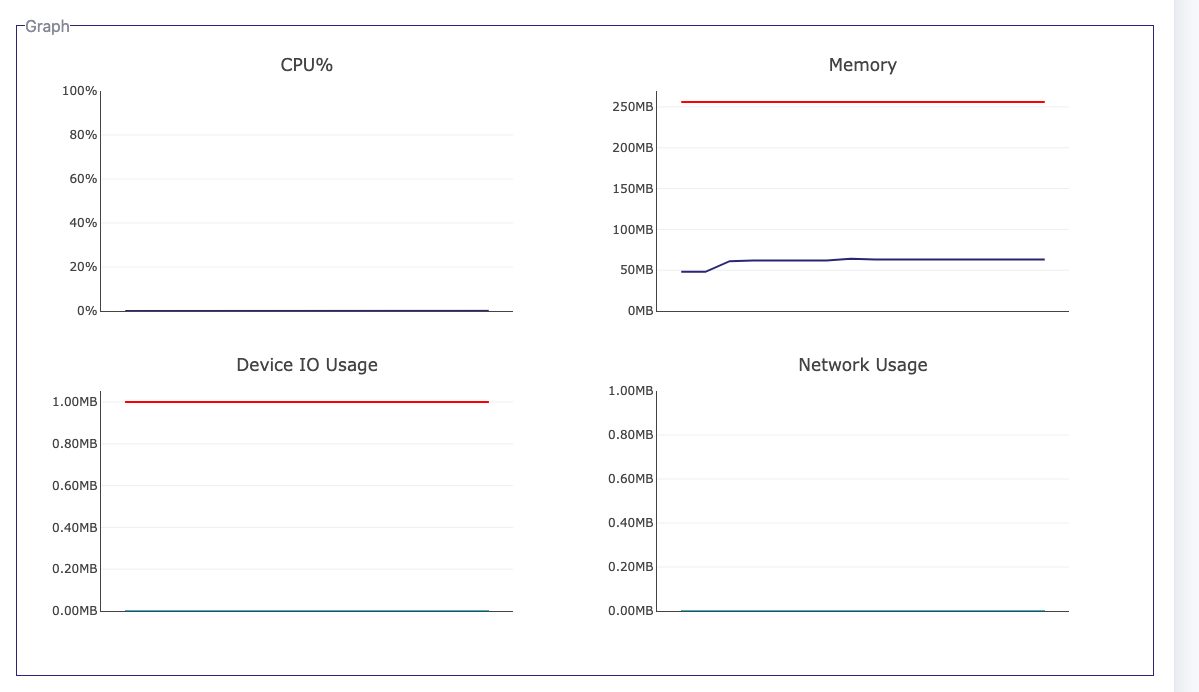
Two things to keep in mind:
- Nothing here needs a click — the numbers arrive on a sampling cycle. "Data is not available." means the first sample has not arrived yet; reload after a minute.
- CPU is a fair-share percentage of your plan's cores, and memory is split between the two sections.
What to do next
Disk or inodes near their limit: raise the disk space in File Manager. CPU or memory high for hours: move to a larger plan in Performance. Status dot still red after a deploy: reboot from Power, then open a ticket.
Related articles
- How to increase disk space for your onion service
- How to change the PHP version of your onion service
- How to check the history of your onion service
Tags:
- Onion Service
- Customer Portal
- Dashboard