Our experts are always on hand to help answer your questions, get you started, and grow your presence online. You can email us any time
How to enable Awstats and Webalizer for your onion service
- Knowledgebase
How to enable Awstats and Webalizer for your onion service
The portal can turn the access log of your website into readable statistics. Awstats and Webalizer are two separate add-ons with their own web interface, and each one costs an additional US$1.00 per month.
Step 1 — Open the Metrics tab
In the Customer Portal, open your onion service and click "Metrics". Two status lines sit at the top — Current Awstats service status and Current Webalizer service status — followed by one card per service with its enable button.
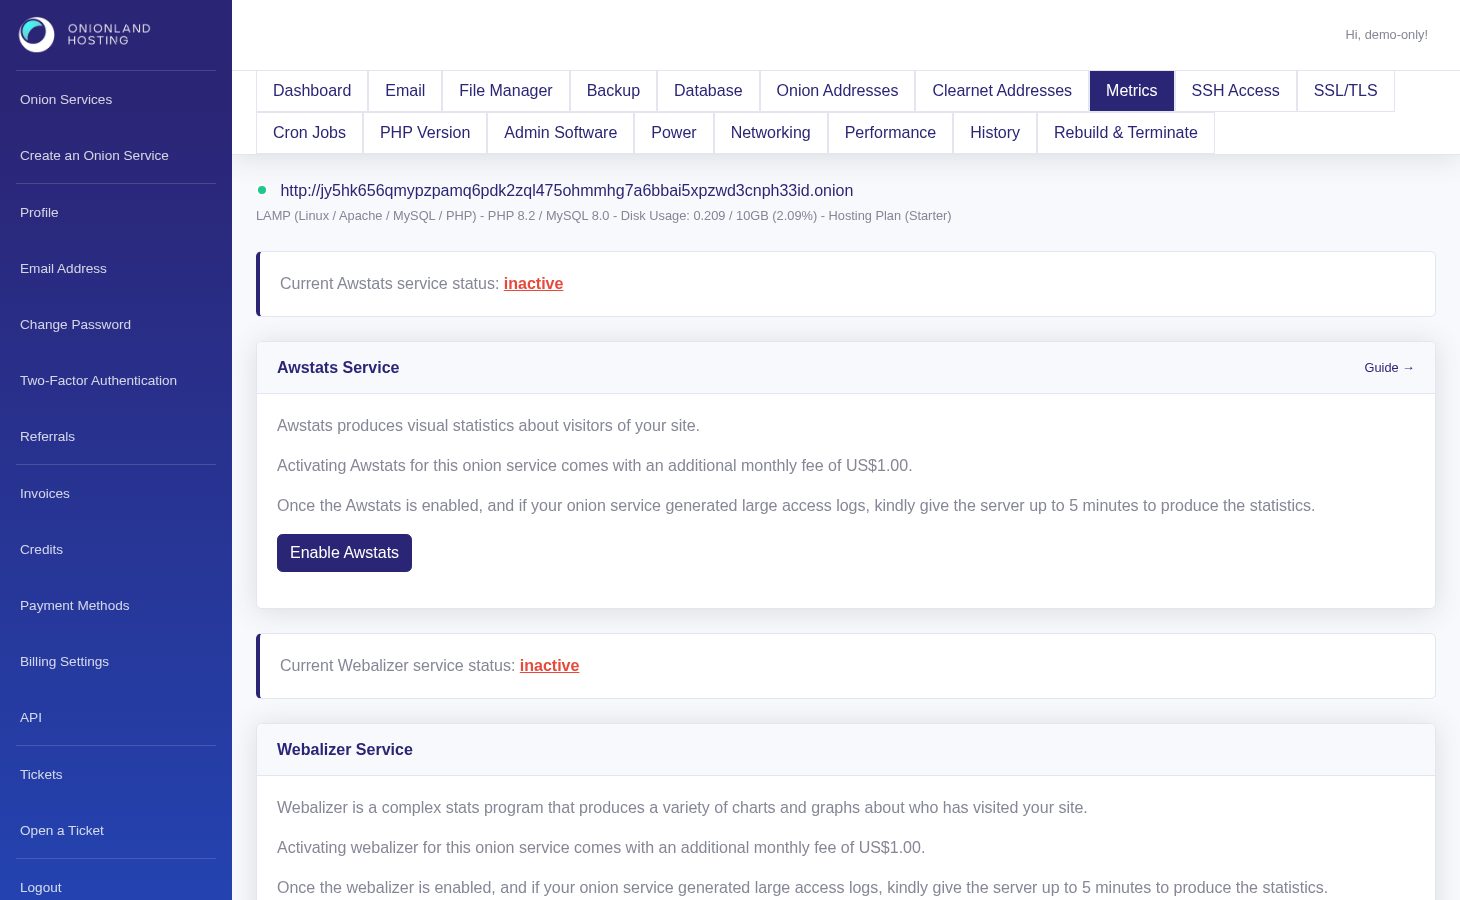
Step 2 — Enable the add-on you want
Click Enable Awstats (or Enable Webalizer). The page reloads with a green message: "The awstats is enabled. You may check the history page to see the latest status." and the status line above it turns active.
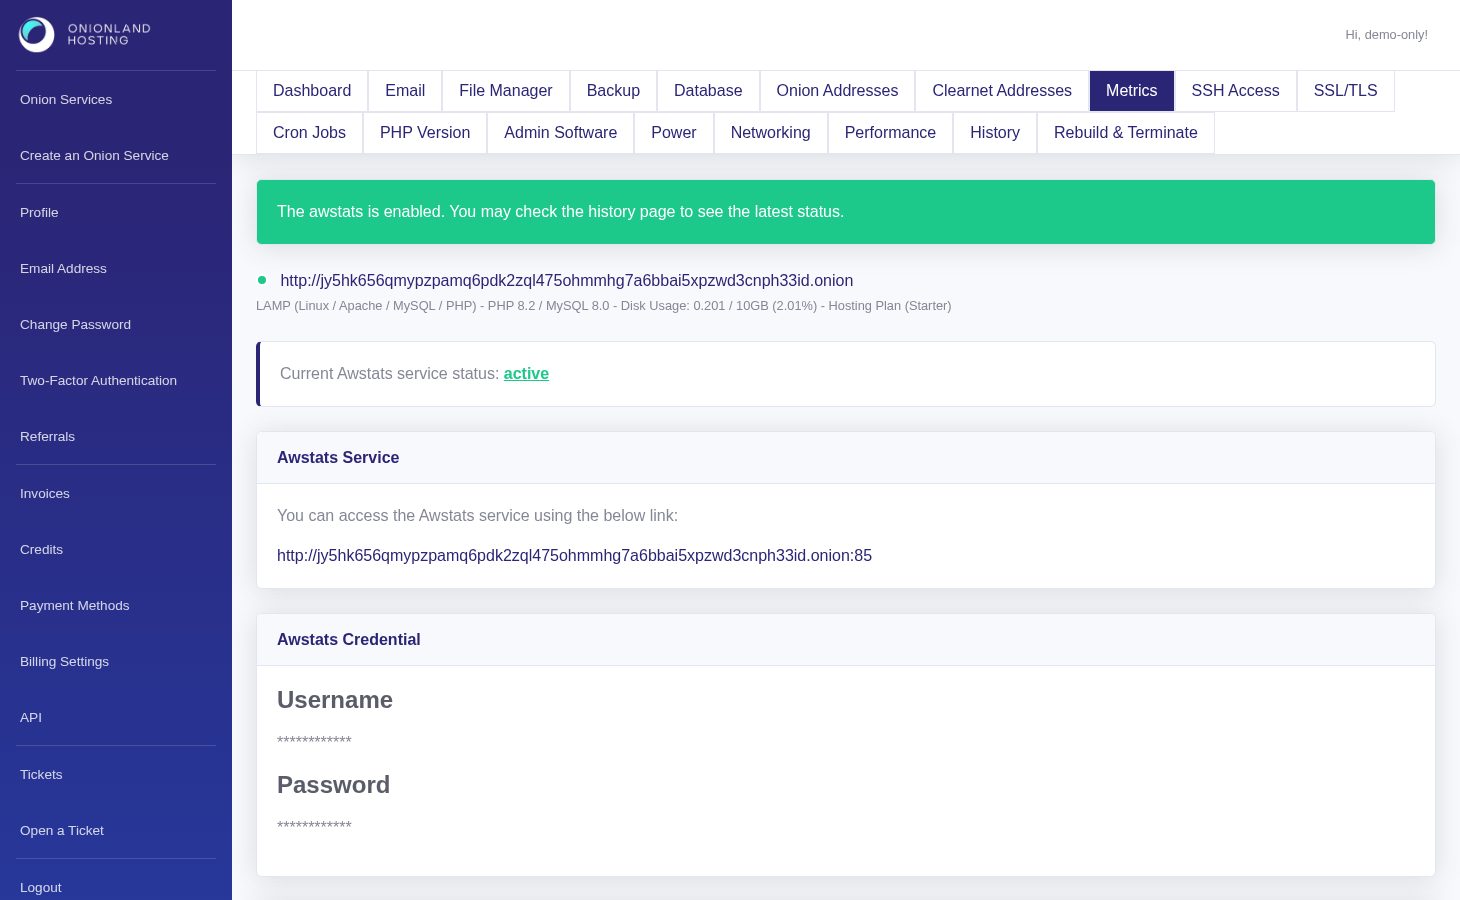
Disabling works the same way and answers "The awstats is disabled." — the add-on is billed monthly, so switch it off when you stop looking at the reports.
Step 3 — Open the report
Once the service is active, a card shows its address: http://your-address.onion:85/ for Awstats and http://your-address.onion:83/ for Webalizer. Open it in Tor Browser. It asks for a username and password: use the same pair as the File Manager, shown on the File Access tab of the same service.
The first report is not instant. The statistics are built from the access log that already exists, so give the server up to five minutes after enabling before the numbers appear.
Step 4 — Read the Awstats report
Awstats opens as two frames: the navigation on the left and the selected section on the right. That navigation is also the list of everything it measures.
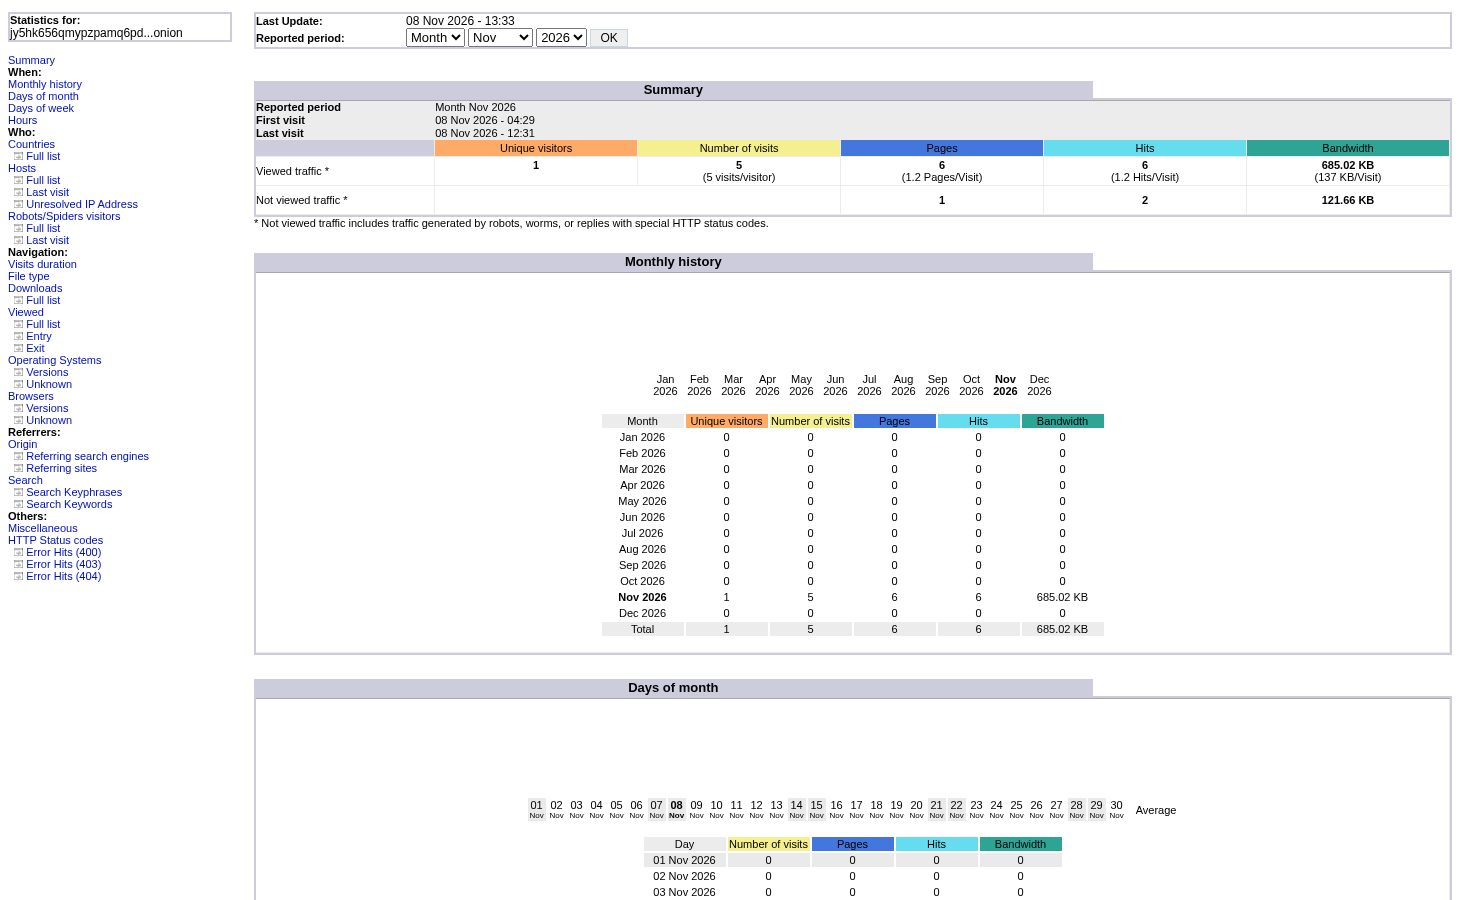
The Summary is the only section you need every day. It covers the reported month and gives five numbers per row:
- Unique visitors — distinct addresses that loaded at least one page: the closest thing to "how many people".
- Number of visits — sessions, not people. One visitor who returns five times is 1 unique visitor and 5 visits.
- Pages — requests for your actual pages, with the average pages per visit.
- Hits — every request, including images, stylesheets and scripts. Hits are always higher than pages.
- Bandwidth — bytes served, with the average per visit.
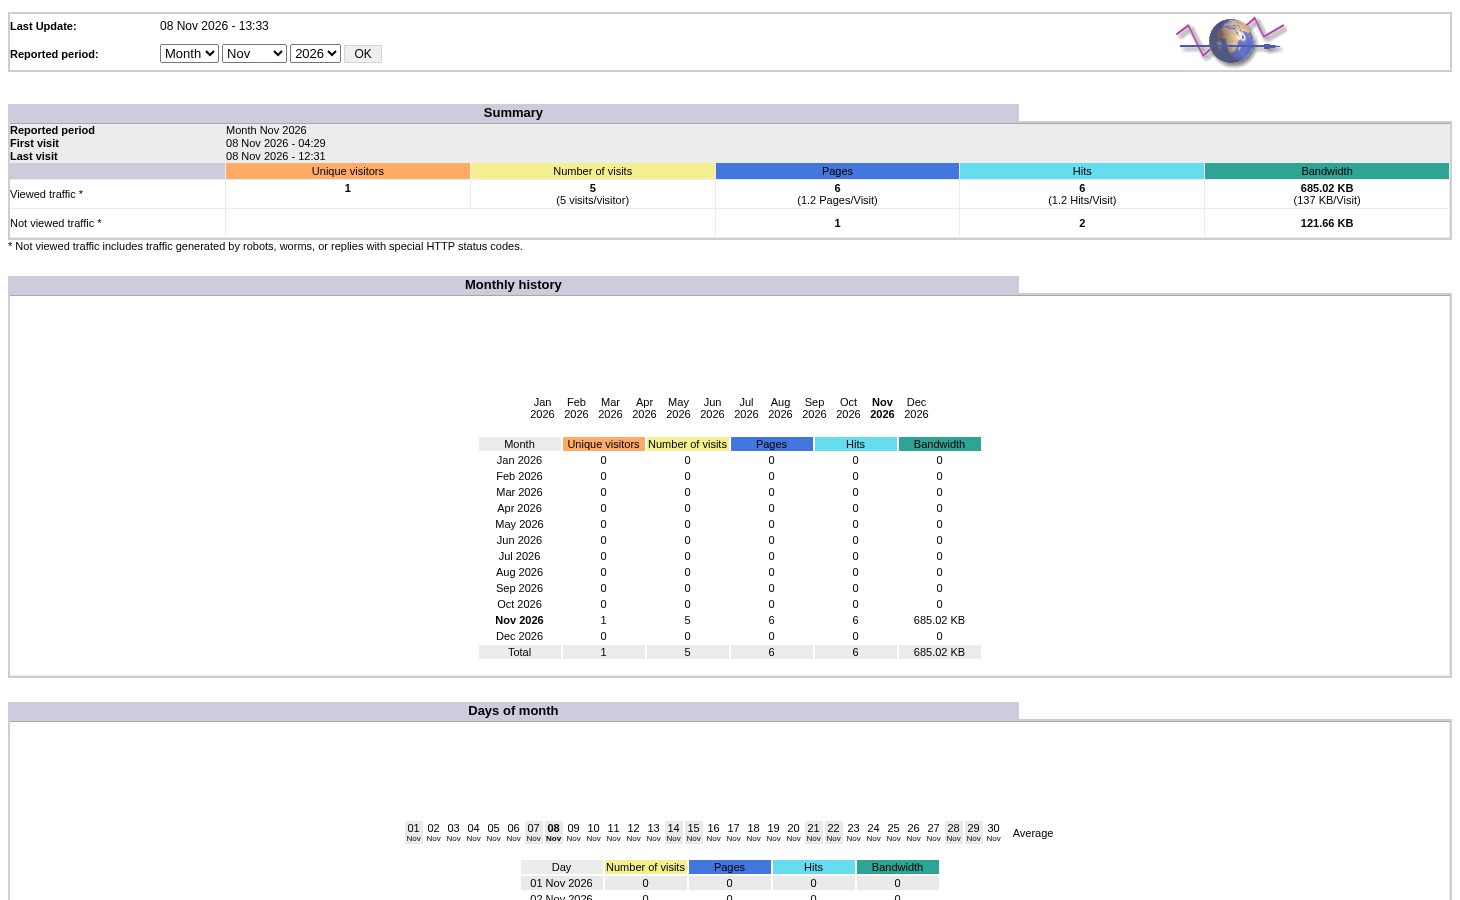
The table is split on purpose: viewed traffic is what real browsers asked for, not viewed traffic is what robots, worms and crawlers asked for. On a fresh site the lower row is often larger than the upper one — that is normal, and it is why you read the first row.
Below the summary the same numbers are broken down by period: Monthly history gives one row per month so you can follow the trend, then Days of month, Days of week and Hours tell you which days and hours your visitors are active.
The remaining groups answer "who" and "from where":
- Countries — visitors per country, taken from the exit node. Tor hides the reader's real country, so read this as "where the circuit left", not where the person lives.
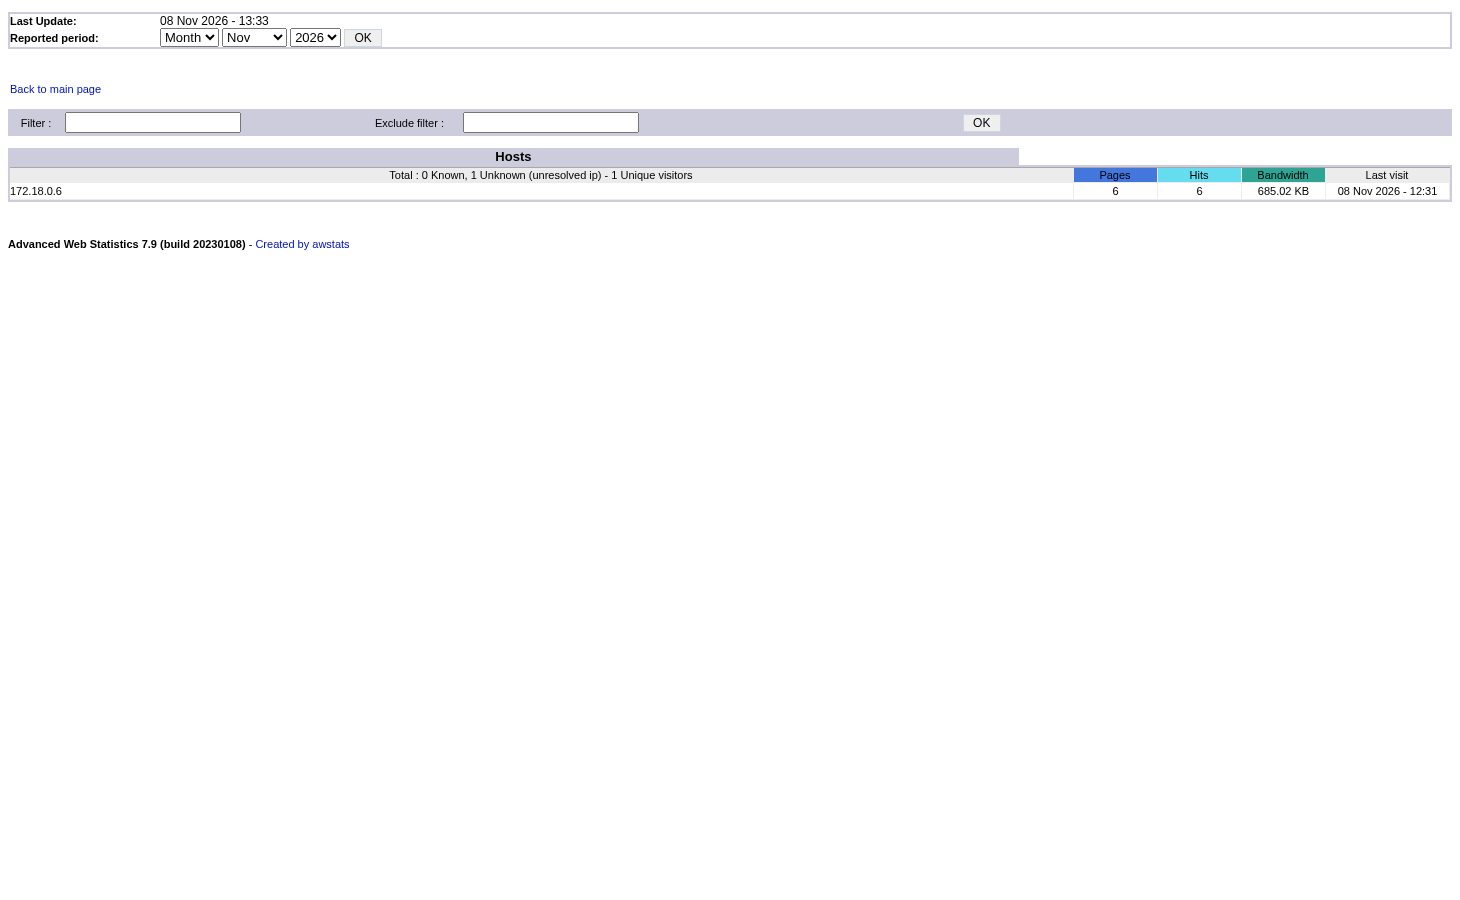
- Hosts and Unresolved IP address — the individual addresses, with pages, hits, bandwidth and the time of the last visit.
- Robots/Spiders visitors — the crawlers in your log, which is where the "not viewed traffic" row comes from.
- Visits duration — how long sessions lasted, in time bands.
- Pages-URL — the most requested paths, with the average size and how often each one was the entry or the exit page of a visit.
- Operating Systems and Browsers — what visitors used, with a version split.
- Referrers — origin, referring sites and search engines, plus the keyphrases people searched for.
- HTTP Status codes and Error hits (400, 403, 404) — every request that did not return a page. A rising 404 count means a link or a file is broken.
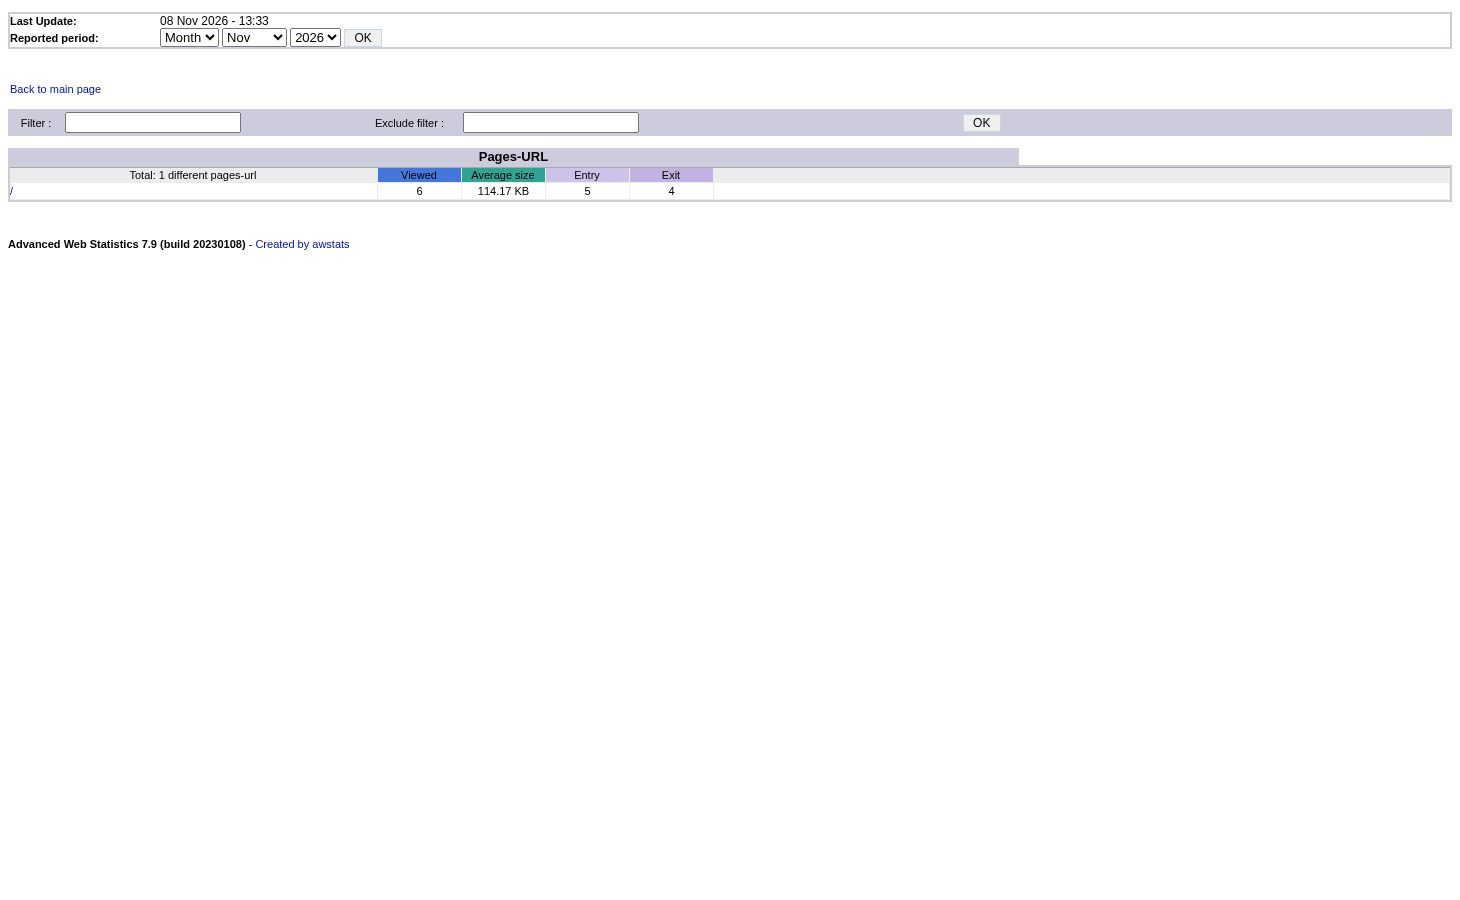
Each section carries its own filter box, so you can narrow the report to one path or one address without leaving the page.
Step 5 — Read the Webalizer report
Webalizer is smaller and more graphical. Its front page is a table of months; open one to see that month in detail.
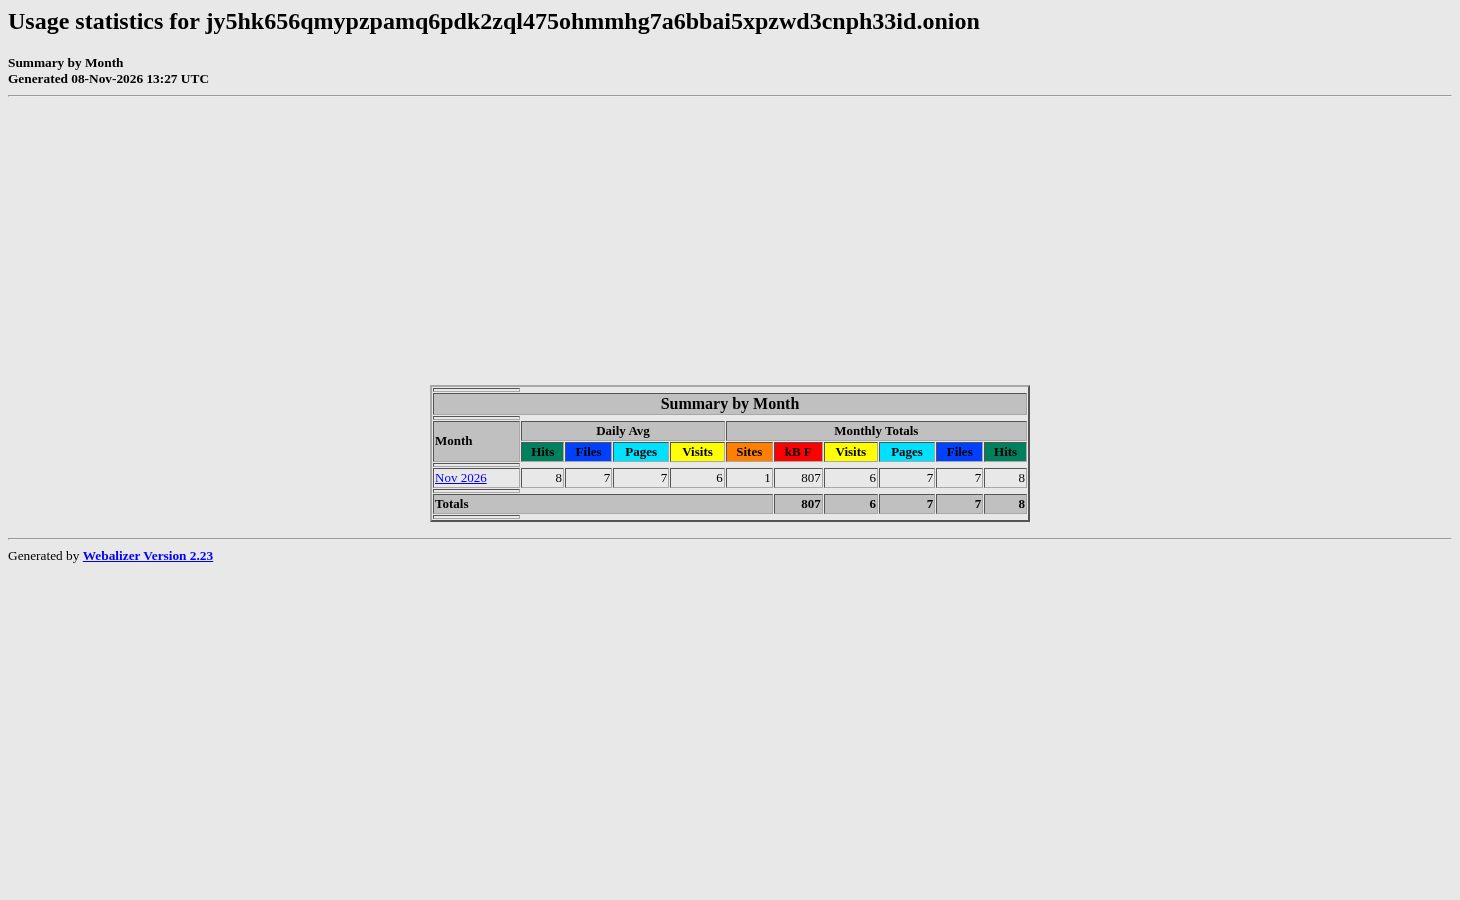
The monthly page starts with the totals, then the average and maximum per hour and per day, then the hits split by response code:
- Hits — every request; Files — requests that returned a file; Pages — pages only; Visits — sessions.
- kB Files — bandwidth in kilobytes.
- Unique Sites — distinct visitor addresses, Unique URLs — distinct paths, Unique Referrers — distinct sources, Unique User Agents — distinct browsers or clients.
- Hits by Response Code — the share of 200 (served) against 404 or 403 (missing or forbidden).
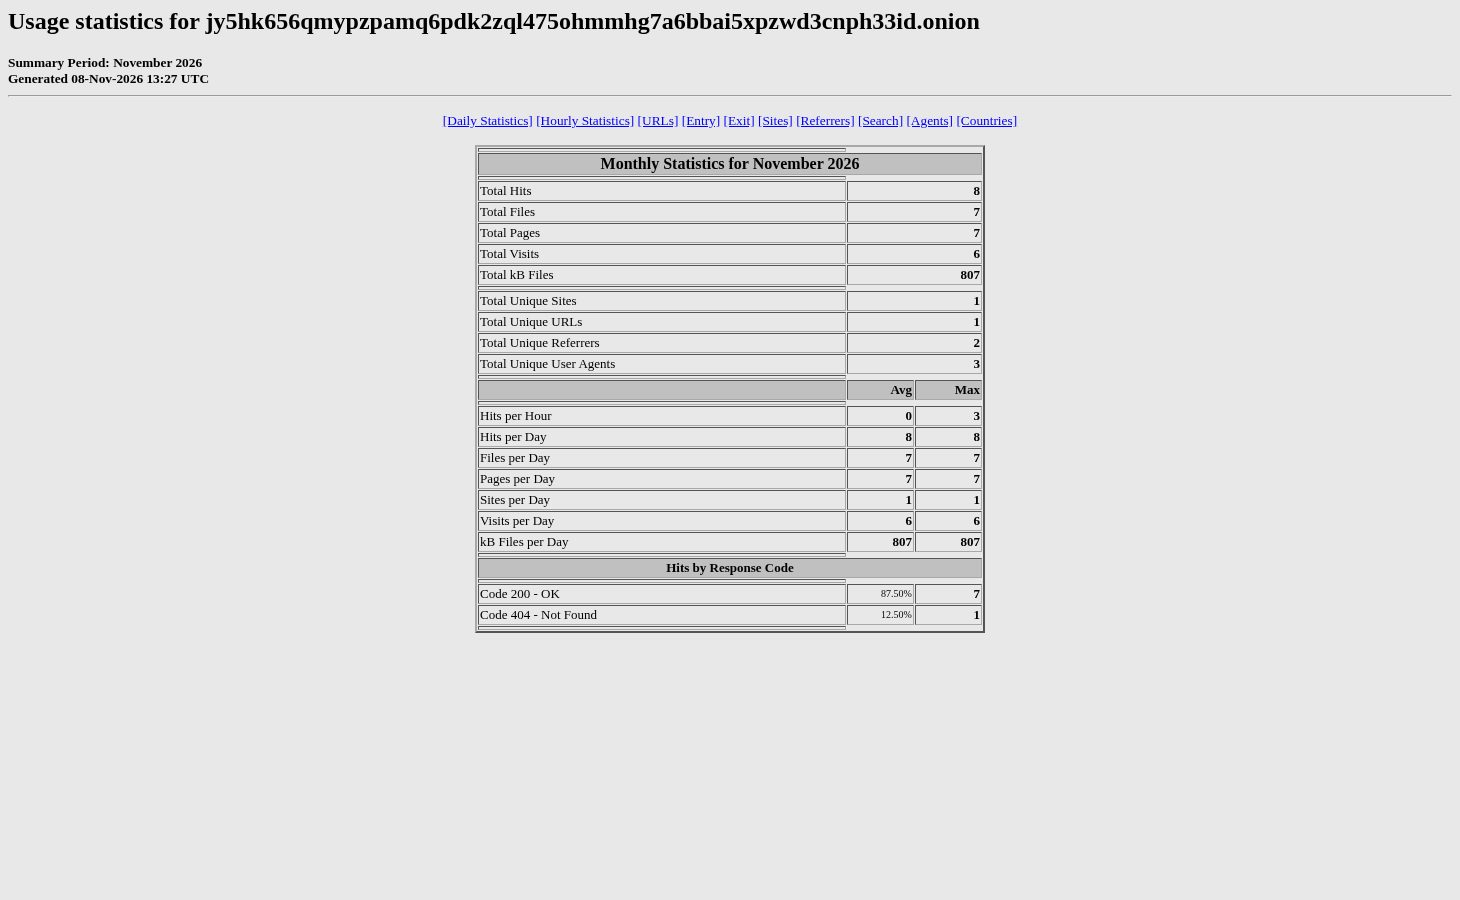
Its navigation repeats the same breakdowns as Awstats: Daily, Hourly, URLs, Entry, Exit, Sites, Referrers, Search, Agents and Countries.
Step 6 — What the numbers cannot tell you
Both tools read the web server log. They run no JavaScript on the page, so they never show a goal or a conversion, and a bounce still counts as a visit. Practical readings:
- Compare pages per visit week over week — Tor traffic is small and noisy from day to day.
- Watch 404 hits: an increase right after you moved or renamed a file is the fastest way to find a broken link.
- Treat countries as an approximation, because Tor only reveals the exit node.
- If not viewed traffic dominates, a crawler is walking your site — check Robots/Spiders before you change anything.
Related articles
Tags:
- Onion Service
- Customer Portal
- Statistics